A College Career, Visualized
by Ben Centra
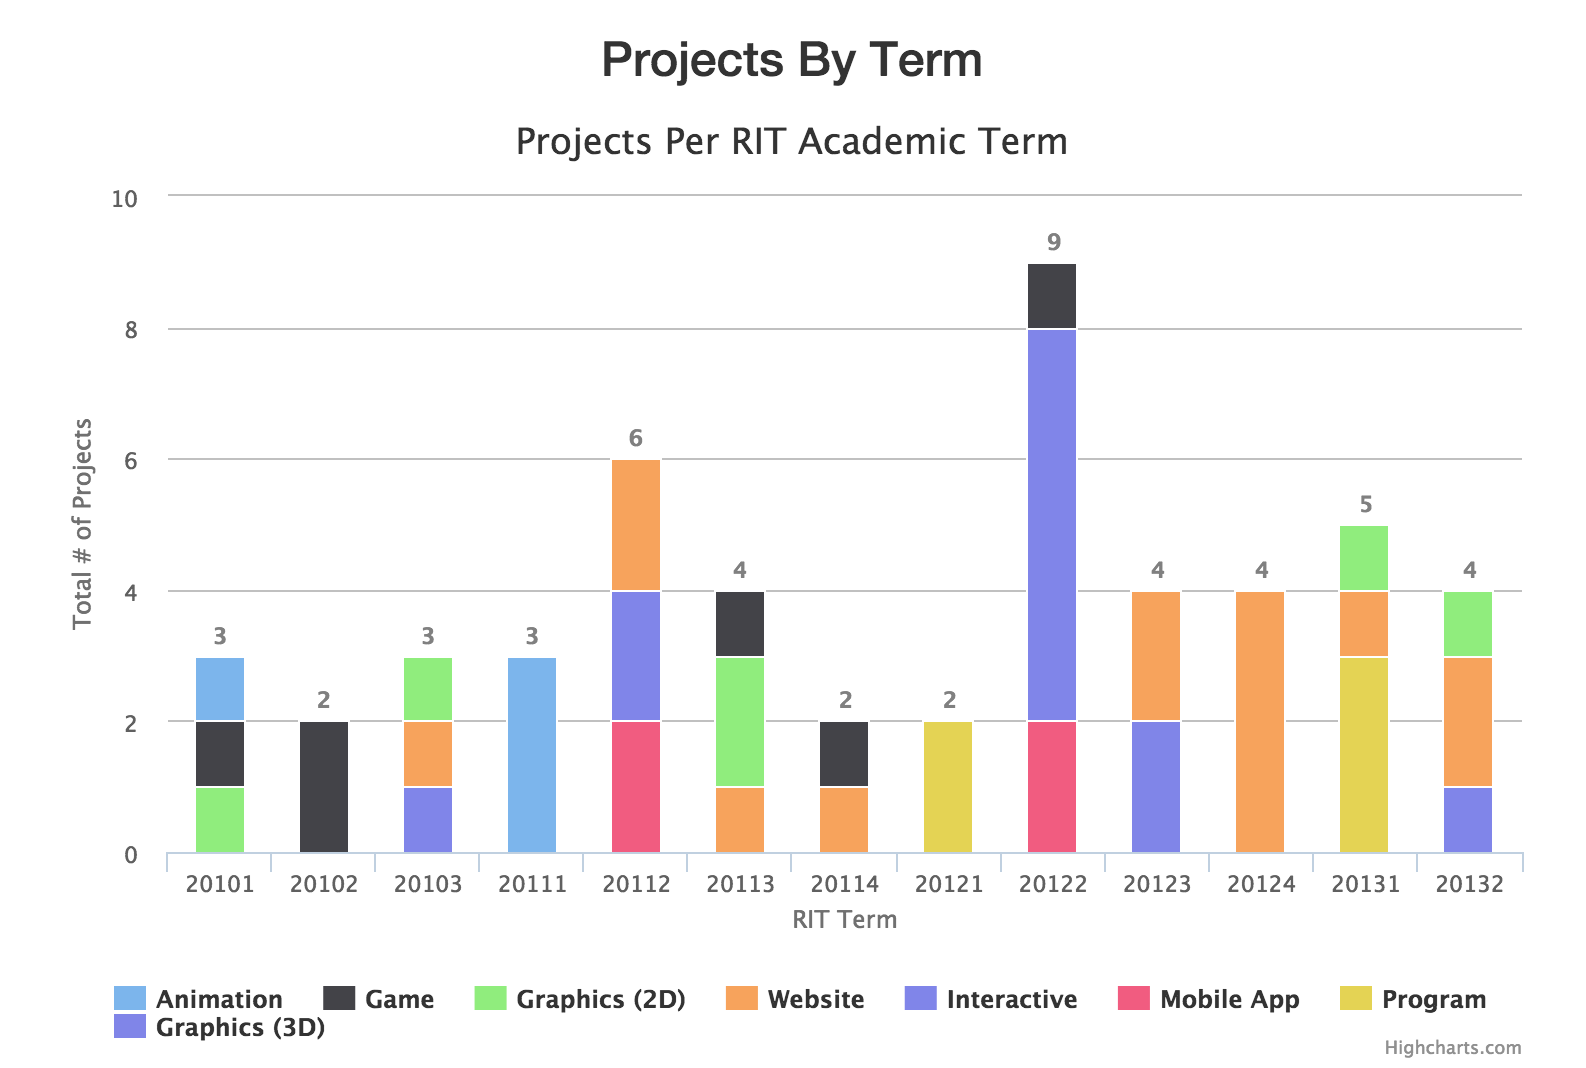
RIT is a career-oriented school, and the New Media program is project-based. Between those things and the “learn by doing” attitude of Computer Science House, I did plenty of projects throughout my four years of college. Over 50 projects, actually - websites, games, and more - spanning over 20 different technologies.
For one of my final projects at RIT, I decided to visualize my college career. Using Highcharts, I created several charts and graphs detailing the number of projects done each term, the types of projects I’ve done, and the technoligies used in those projects.
Click here to view the website!
Subscribe via RSS